Introduction 
The Excess Power method is designed to detect burst signals of unknown waveform, which is basically the case for GNOME and its search of Axion-Like Particles (ALP). This method was developed and introduced by Anderson et al. (2000) and has been extensively used in the detection of burst sources of gravitational radiation. A more technical documentation was written by Brady et al. (2007) describing how the algorithm used by the LIGO collaboration works and how the theory is translated into code.
We will be describing the entire algorithm further below and explain how the data are processed to extract meaningful physical information. Although the algorithm can be quite sophisticated, the methodology is actually not that difficult to grasp and simply consists of mapping the entire time-frequency space covered by the data by splitting it into different tiles and explore different bandwidth and duration in order to search and identify trigger signals. In the figure further below, we show the four ways the data will be split and processed, namely, by segments, channels, blocks and tiles.
An important aspect of this analysis technique is the filtering that is involved and used to create individual tile’s time series. Indeed, when one converts the time series of the extracted dataset into Fourier space, one can see signals covering a large range of frequency from 0 to the Nyquist limit. However, if one wishes to identify signal from a tile of specific bandwidth and covering a specific range of frequencies, any signals outside that range should not be present in the tile’s time series. The filtering is used to filter out those signals such that the time series of any given tiles only contains signals that lie within the tile’s frequency domain.
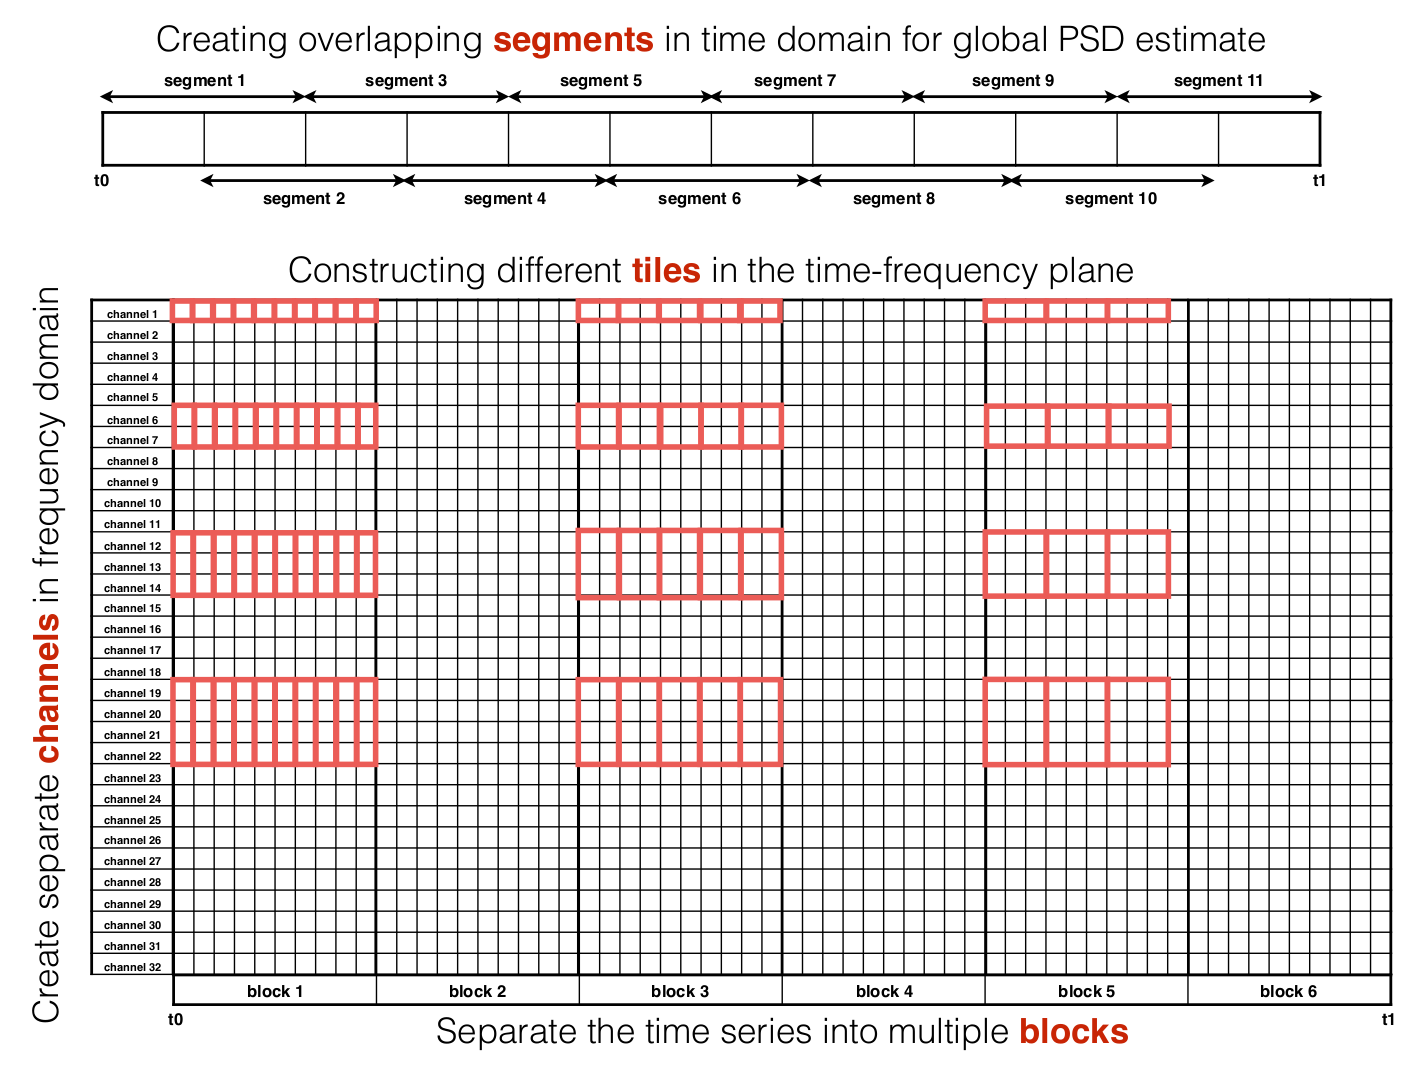
Overview of the Excess Power method and difference between segments, channels, blocks and tiles. 
Adaptation for GNOME network 
First implementation 
Chris Pankow originally shared an iPython notebook that provides some details on the excess power algorithm and the filtering process, based on Brady et al. (2007) . As presented in that publication, there have been several improvements and streamlined. The original implementation in C is part of LSC Algorithm Library Suite . Most package managers can pick up this program if they can install a package called lalburst . It is 99% complete and should do most of the things we want to do initially.
Chris Pankow reimplemented this algorithm twice:
-
The first implementation is using the gstreamer media streaming framework for very specific reasons which are not germane to GNOME. This version is available here and is part of the gstlal-burst package, which should be installable from a package manager. The program was used to produce the toy result in the original GNOME paper. However, although this version is also nearly complete, it still has a critical bug which has prevented its development and usage for more than a year.
-
Because of the bug from the above version, Chris implemented another version which is a Python executable and is part of the pyburst project . This version is installable by pip , though the release Chris currently has does not include the excesspower program because it requires a good shakedown.
Warning
Input format: All these programs are LIGO specific and use format different than HDF5. The lalburst and pyburst version will be fairly trivial to hack, but the gstreamer version will not.
The analysis depends on what we want to do. If we are just interested in looking at spectrograms, then we don’t need any of that, and a simple program can be written to read in HDF5 and make those using gwpy . On the other hand, if we are interested in doing joint analysis of generic excesspower triggers, then we have to define the common bandwidth and what we expect from said analysis. The calibration of the data streams will also need to be handled.
The best way forward is probably the pyburst version since it should be straightforward to install, and is probably the easiest to understand form a code version. If we want something that just works , the oldest version (i.e. lalburst) can easily be hacked to take in HDF5 and we can go from there.
From pyburst to gdas 
The original
pyburst version
of the excess power algorithm has been used to perform multiple analysis such as the data analysis of the
March 23rd, 2016 science run
or the
test examples
provided during the data analysis bootcamp at Northwestern University in August 2016. In an effort to ease the analysis within the GNOME collaboration, we have built this
GNOME Data Analysis Software
(GDAS) where analysis techniques can be accessed via python modules. We implemented the excess power algorithm from the pyburst version in the
gdas.excess_power()
module.
Structure of the algorithm 
The excess power algorithm can be executed in two ways, either by importing the
gdas.excess_power()
module or by using the
gdas executable
directly from the terminal.
Using the python module 
If one wishes to write a python script that will perform, among other things, an excess power analysis on some data that have already been extracted, the most straightforward way to do it is to call the
gdas.excess_power()
function, which is part of the epower.py module. Apart from the actual time series data extracted from the data files, the module needs no other parameters in order to run. However, it is possible to manually changed the values of some pre-defined variables essential to the algorithm. Below we list all the input parameters along with their default value if applicable:
import gdas
station = 'fribourg01'
t0,t1 = '2018-06-15-09','2018-06-15-10'
data_path = '../GNOMEDrive/gnome/serverdata/'
ts_data = gdas.get_data(station,t0,t1,data_path)[0]
gdas.excess_power(ts_data,tile_fap=1e-7)
Using the executable 
If one only wants to simply do the excess power on the data, and nothing else, it is possible to run the
gdas
executable directly on the terminal. This will call the necessary functions to either extract or generate the time series data, and do the excess power search. The arguments can be user-defined using the available options of the program, which can be display using the
-h
or
--help
option command:
We show below how the program can be executed on real dataset:
#!/bin/bash
gdas excesspower --station fribourg01 \
     --start-time 2018-06-15-09 --end-time 2018-06-15-10 \
     --data-path ../GNOMEDrive/gnome/serverdata/ \
     --tile-fap 1e-7 --output trigger_map